The most effective way for humans to understand large, complex sets of data is through visual representation. Data visualization is growing in significance and complexity as the data and supporting technology matures. Virtual Data Warehouse, Data Visualization and Data Extraction in Real-time have taken business decision-making to a higher level. Companies are investing heavily in advanced data visualization systems, leveraging the available large data sets to stay ahead.
- Home
- Technology
- Business Intelligence
Overview
Capabilities / Services
- Visualization and Creative Solutions
- Customer Centric Framework
- Collaboration & Data virtualization
- Mobility and User Experience - Design
- Instant Improved access to decision making while on the go
- Native and Browser Mobile BI Platform
- Data Visualization Framework BI Self Service
- Provides an easy-to-use BI tools framework to help you generate your own reports
- Analytical BI and Predictive Modelling
ETL
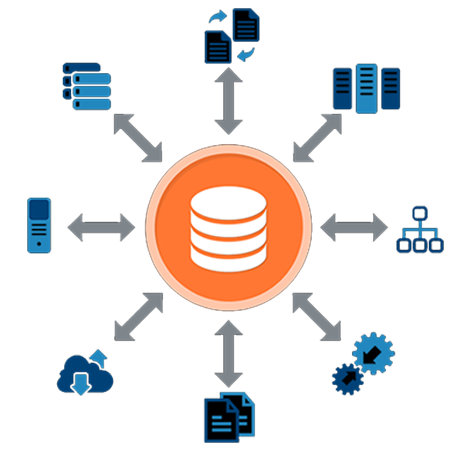
- Connects and Reads from diverse sources
- Extract from disparate sources such as structured databases, flat files, XML, unstructured data and web/FTP servers.
- Standard and custom validation and cleansing capabilities including entity resolution.
- Data storage techniques include Normalization, Encryption and Decryption Extensive Transformational Capabilities.
- Logical, statistical, mathematical functions for complex transformational capabilities.
- Generate new fields or values based on aggregate data, or defined functions.
- Store calculated values for faster retrieval.
- Combine data from multiple sources to create new data sets
Smart Execution . - Batch job execution for parallel ETLs.
- Scheduled as well as on-demand transformations with detailed logs and post-transformation alerts.
- Automated mails to specific lists.
- Auto-delete after a process.
- GUI-based interface for ease of design

VISUALIZATION
- Dashboard Designer
- Design-it-yourself: Create custom dashboards with 100+ customizable charts.
- Interactive: Dig deeper using dimension filters and drill-down capabilities.
- Favorites: Add important KPIs to the page for a running indicator
Slice and Dice . - Create data pivots that include sub-totals, filters, conditional formatting, data sorting.
- Paginate datasets to simplify navigation.
- Save and Schedule views to reach multiple users.
- Download to Microsoft Excel, CSV, PDF.
- Decision support and Reporting.
- Access on the desktop browser, mobile device and through plug-ins for Microsoft Excel and Outlook.
- Decision support capability including alerts and exception reports.
- Report designer functionality.
- An add-on module, that provides single view to multiple indicators of the business
- Combines and harmonizes data from diverse and multiple data sources to present complex KPIs
- Custom-designed user interface
- Drill-down capability to reach the atomic data level